 WhatRoute HelpWhatRoute Help
The Trace Performance window is an alternate way of performing a traceroute command. It is focused on reporting the statistics (packet loss, mean rtt and standard deviation) associated with each hop in a route but does not provide all the options available in the main WhateRoute trace command.
Discovered routes are forwarded to the Map Window.
Principle of Operation
The traceroute command is run in a tight loop sending ICMP probes to
each router.
Choose a target to probe and press the Trace button to begin probing. The Trace button is relabled as Cancel while a trace is in progress.
The statistics are collected, analysed and displayed every 2 seconds by default. The update frequency can be changed via the Action button in the tool bar.
Each hop is probed every 500ms by default.
You can change the interval between probes in the Trace and Ping preferences. If you set this value too small you may see increased packet loss at each hop while your Macintosh struggles to send the high volume of probes.
Each hop will be probed until you click on the Cancel button, or until the specified maximum number of probes have been sent.
You can save the contents of the table to a csv file using the File/Save and File/Save As menu commands. The csv file can be opened with spreadsheet software such as Numbers, Libre Office and MS Excel.
Trace Performance Window
 Open the Trace Performance
window by selecting the menu command Window/Trace Performance.
WhatRoute will remember the size and location of the window. If the
window is open when you Quit, WhatRoute will re-open
it next time the application is run.
Open the Trace Performance
window by selecting the menu command Window/Trace Performance.
WhatRoute will remember the size and location of the window. If the
window is open when you Quit, WhatRoute will re-open
it next time the application is run.
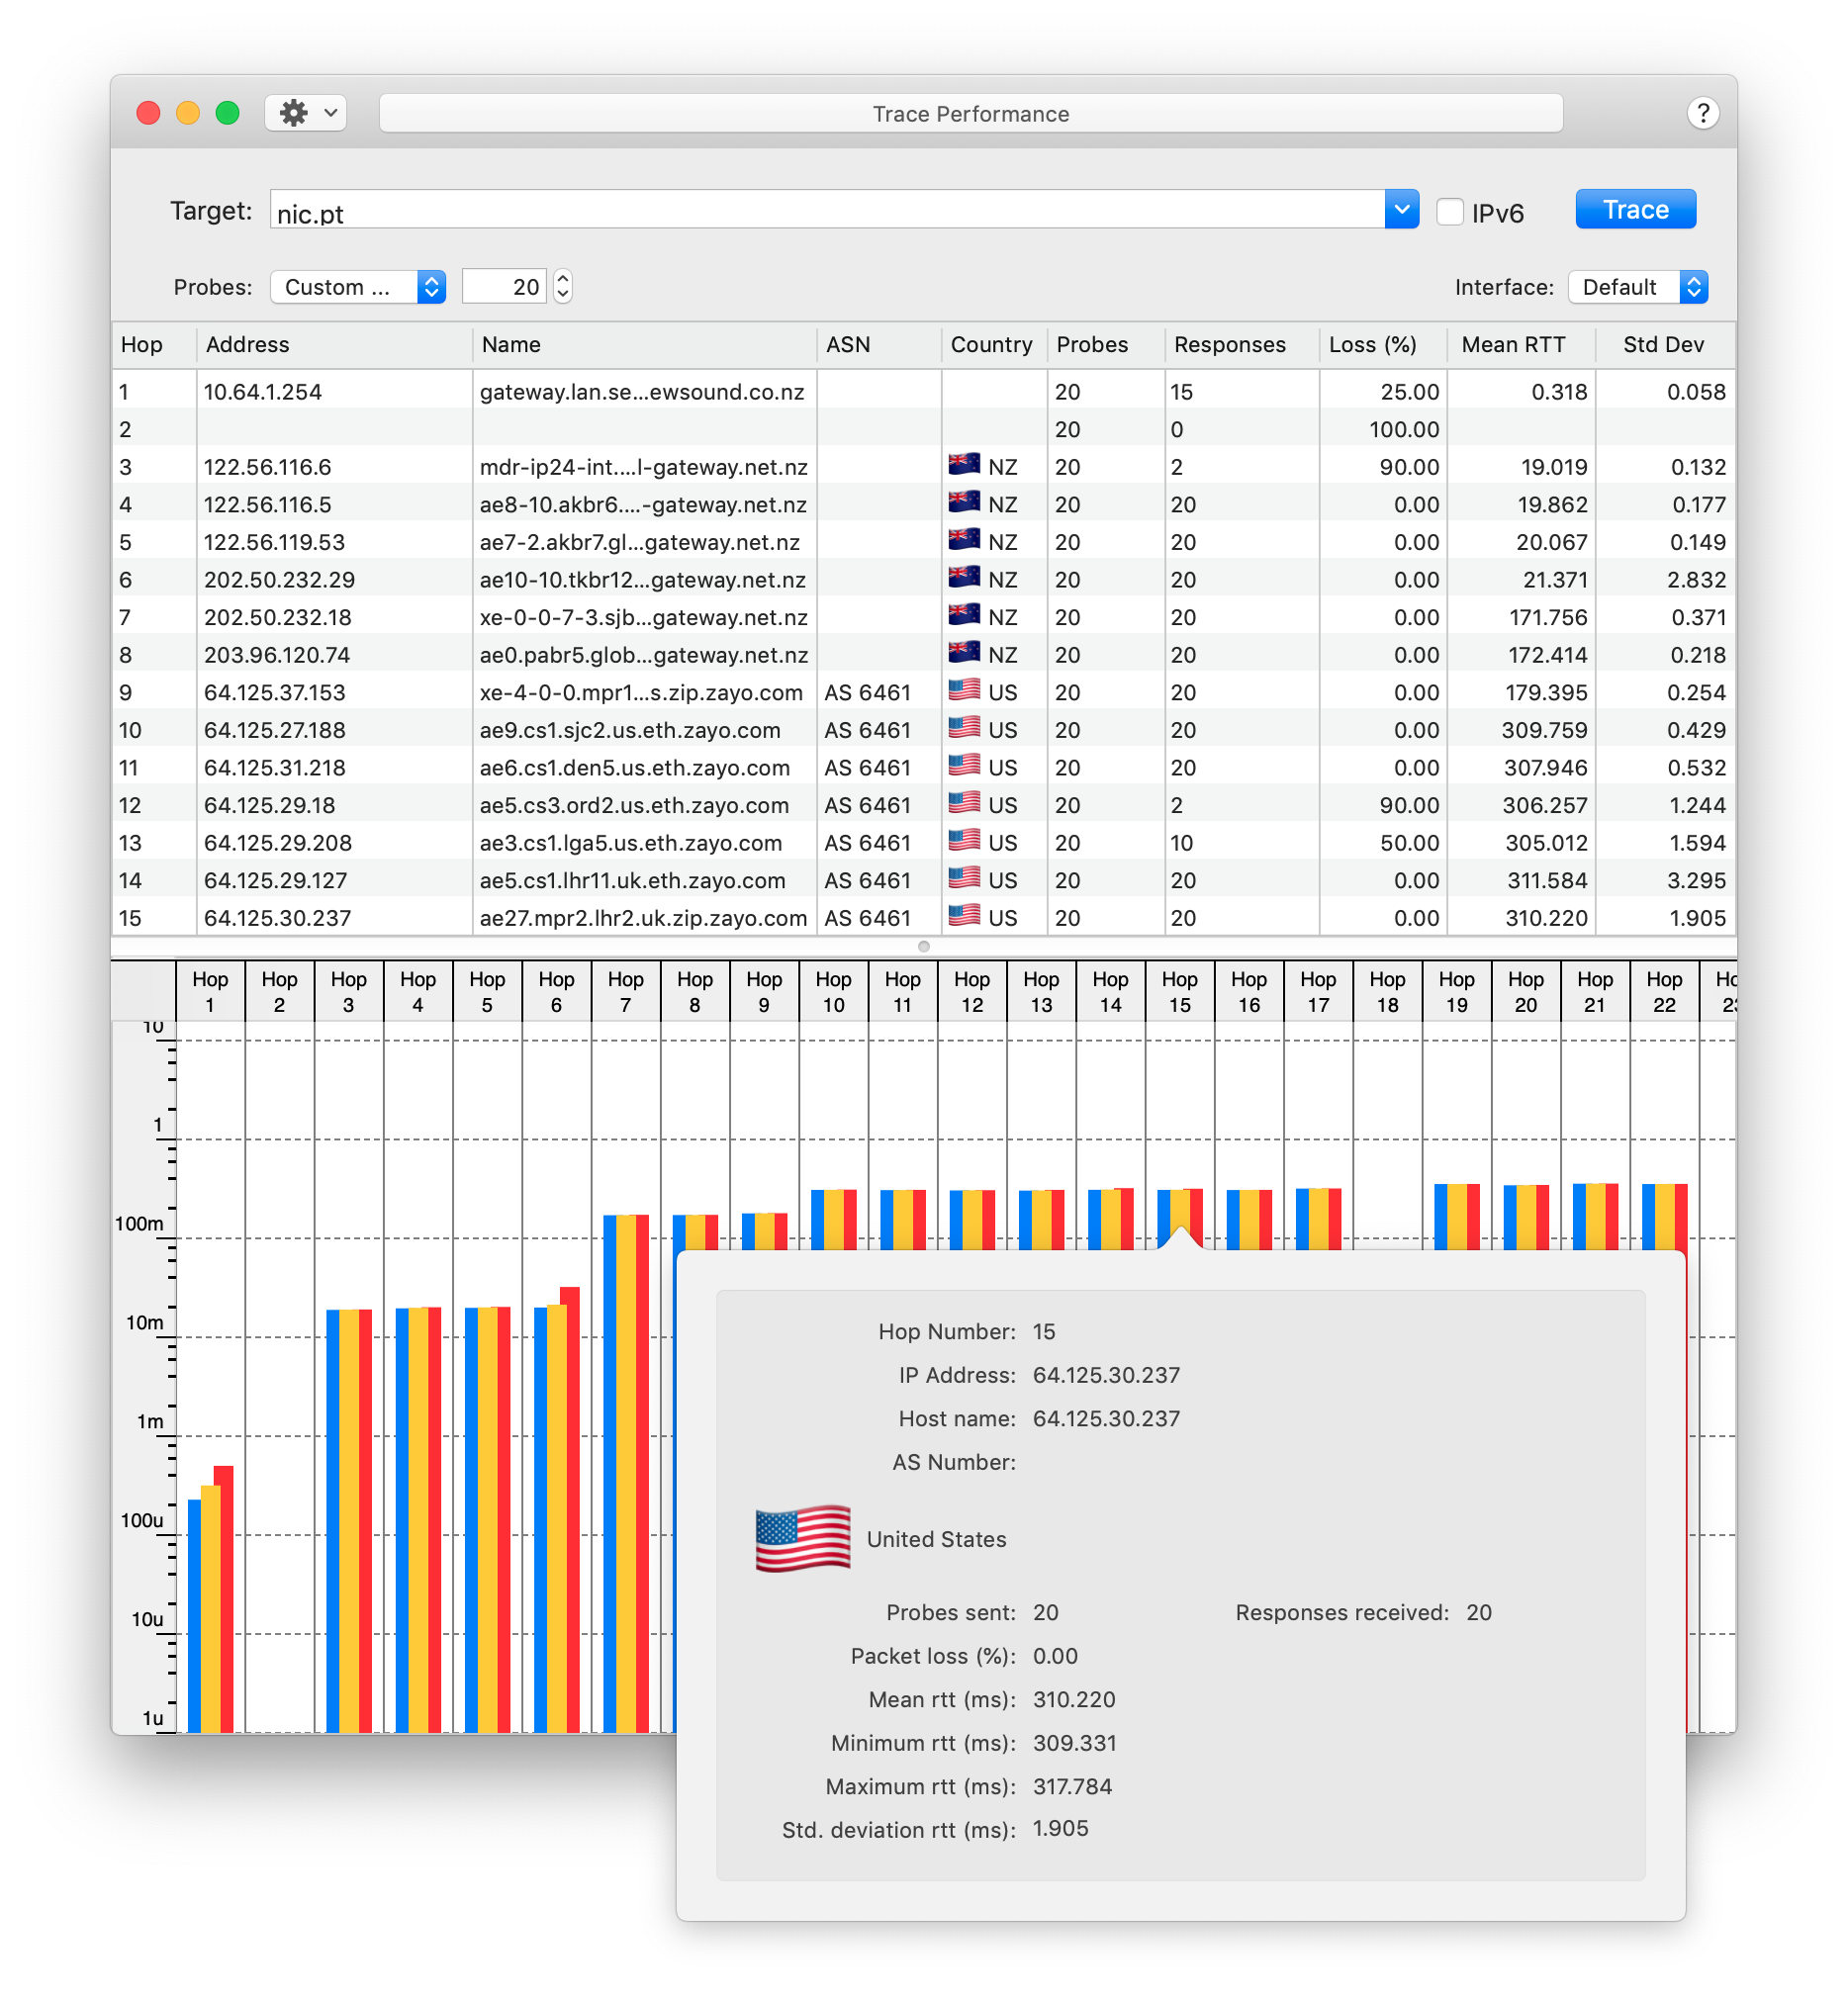
The window is divided into two panes. The upper pane tabulates the results of probing each hop, lower pane presenting the same results in graphical format.
Click on the divider and drag it up or down to changethe relative pane sizes.
If you click an entry in the graph, a popup window will display the statistics for that hop.
Enter a target host name or IP address into the Target text field. You can choose a previously targeted host name from the drop down menu associated with the text field. If you enter a new host name it will be remembered in the menu of previously targeted hosts.
The menu command Edit/Edit Hosts… may be used to add or delete entries to or from the menu of target hosts.
You may perform either IPv6 or IPv4 probes to the selected address.
The Probes popup menu and associated number entry field is used to set the the maximum number of probes to each router. You may also set this menu to perform Continuous probing of the target host.
If your Macintosh has multiple network interfaces, you can select the interface to use in the traceroute from the Interface pop-up menu.
The columns in the table are resizable, by click/dragging the column separator marker in the table heading.
A right-click (or ctl-click) in the table heading shows a popup menu of column titles. Visible columns have a check mark. Hide or Restore a column by selecting its name in the menu.
A right-click (or ctl-click) in a row of the table shows a popup menu of commands to be executed in the main WhatRoute window for the IP address of the selected hop.