 WhatRoute HelpWhatRoute Help
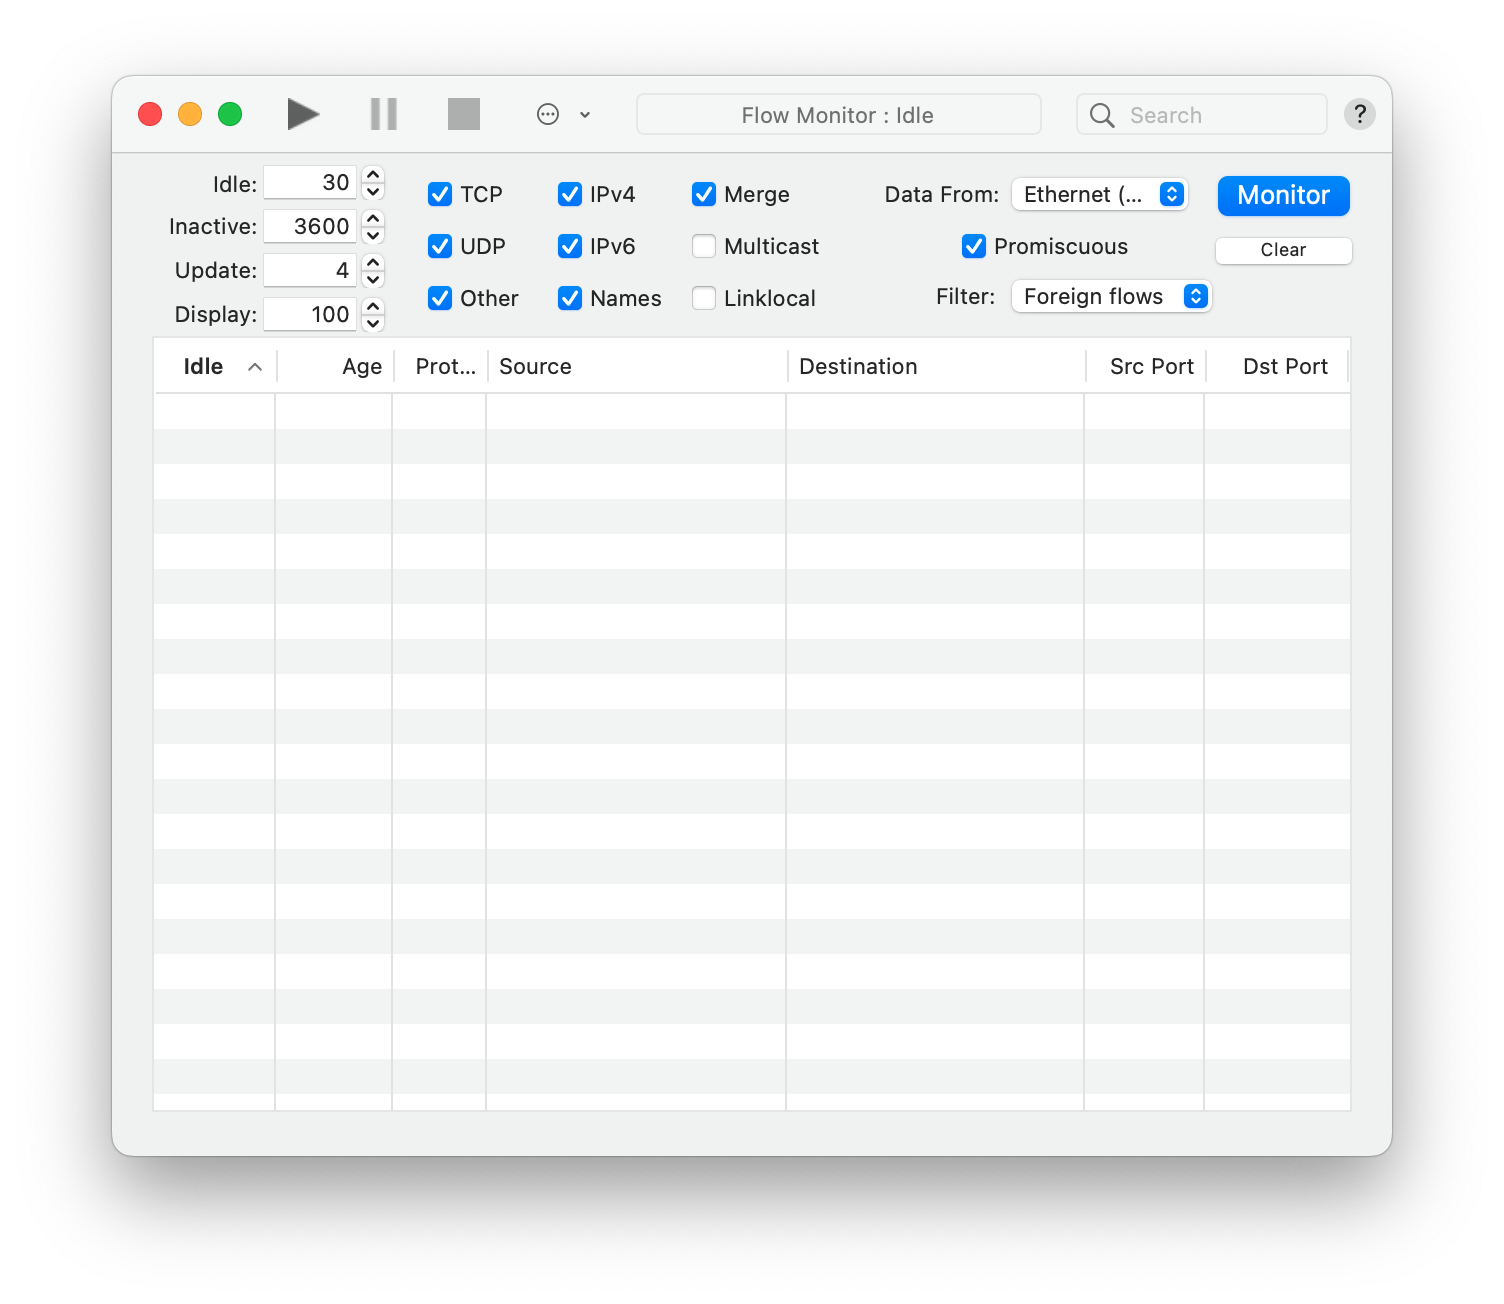
The Flow Monitor window displays a table of the network flows seen by the selected network interface.
A Network Flow is a summary of the packets seen on a network interface with common characteristics of source/destination IP addresses, network protocol and source/destination ports.
WhatRoute enables you to view other detail such as the amount of data associated with the flow, the process on your machine that is participationg in the flow etc.
The contents of the table can be saved to comma separated variable (csv) file with the File/Save … menu items. The saved file can then be loaded into a text editor, or spreadsheet program such as Excel.
A visualisation of the flow data is available in the Flow Treemap.
Response times for a specific port can be measured in the Flow Distribution window.
Open the Flow Monitor window by selecting the menu command
Window/Flow Monitor. WhatRoute will remember the size and
location of the window and re-open it next time the application is
run.
If Resume monitors … is
checked, WhatRoute will immediately begin collecting and displaying data
for the selected interface. Otherwise, click the Start
button.
You can open multiple Flow Monitor windows. Open a new monitor with File/New Flow Monitor. This is useful if you wish to simultaneously monitor Ethernet and WiFi, or a Netflow data source.
Toolbar
The toolbar has controls for starting, stopping and pausing the Flow
Monitor.
It also contains a pulldown menu to give quick access to commands, including advanced filtering conditions.
The Search field will perform simple text matching. Table records that contain the search test in at least one column will be displayed.
Window Header
The window header provides controls that will perform coarse filtering
on the data presented in the table.
At left side of the header are 3 numeric data fields that control display of data.
Idle - Do not display any flow that has not been updated for
this number of seconds.
Inactive - Discard any flow that has not had any network
activity for this number of seconds.
Update - Refresh the display at this interval (seconds).
Check boxes - The group of 7 check boxes perform quick filtering or display modification.
Names - Use names rather than numeric values where possible. When this box is checked WhatRoute will use DNS to transform IP addresses to names and also substitute strings for items such as port/services, protocols etc.
Merge - By the strict definition of a flow, packets sent to a host are in a different flow than packets being received from a host. Checking Merge relaxes this rule and the forward and reverse flows are combined into a single entry.
Data From - Select the network interface to monitor. Alternatively you can use a Netflow source (see Netflow notes below). This selection cannot be changed while the monitor is running. You must stop the monitor if you wish to change monitoring from e.g. Ethernet to Wi-Fi.
Promiscuous - If checked all packets visible to the interface will be collected. When unchecked only packets addressed specifically to or from your computer are collected.
Filter - You can choose to display all flows, local flows or foreign flows. A local flow has both source and destination endpoints on your LAN. This includes multicast, and linklocal flows. Foreign flows have at least one endpoint with an address outside your local network, i.e. hosts somewhere in the Internet cloud. By default all flows, local and foreign, are displayed.
Netflow - For advanced users only.
WhatRoute can collect flow records from a Netflow exporter (such as a
router) and use them in place of flows derived from monitoring the
network interface of your Mac.
Netflow versions 5, 8, 9 and 10 (IPFIX) are supported.
In WhatRoute, you must set the Netflow port (default 2100 and must be 1024 or greater) and can optionally set the IP address of the Netflow source router.
You must configure the Netflow source router to send records to the IP address and listener port of your Mac.
You may also need to configure your Mac with a static IP address and ensure that any firewall(s) allow packets from the router to the configured listener port (UDP).
Timestamps are normalised relative to the time the records are received by WhatRoute, although the flow durations are preserved.
Depending on the configuration of the Netflow source, it may take a few minutes before you see any data.
I cannot go into the details of Netflow configuration issues because they are totally dependent on the hardware/software on your network.
WhatRoute uses nfacctd (from the pmacct project at http://www.pmacct.net/) to collect the flows.
Table Header (column titles)
The table follows normal macOS data table conventions.
sorting - click a column title to sort the table either
ascending or descending by the value in that column.
reordering - Click-Drag a column title to move it either left or right in the display.
Showing/Hiding columns - Right click (ctrl-click) anywhere in the table column titles to display a popup menu of visible and hidden fields. After selecting a hidden field you may wish to reorder the columns or resize the window to bring the newly selected field into view.
The columns menu is also available in View/Flow Columns
The column titles should be self explanatory. Please email me bryan@whatroute.net if further explanation is required.
Table Body
Right clicking (ctrl-click) on the value in certain columns will reveal
a popup menu of actions that may be taken.
e.g. If you right click on a host name or IP address you can execute a
command such as whois to find out more about that
address/host.
You may wish to Pause updates before performing this analysis.