 WhatRoute HelpWhatRoute Help
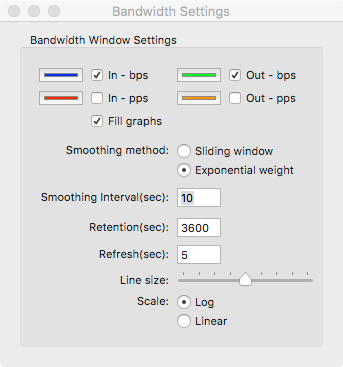
Colour and type selection
Clicking the colour swatches lets you modify the colour with which each
value will be plotted.
Clicking the check boxes determines which values will actually be
plotted.
Fill graphs
If checked, the area between the graph and the bottom will be filled
with a faded version of the colour selected above.
Smoothing method and interval
You can use either an average of samples over the previous Smoothing
interval, or an exponentially weighted average from the start of the
collected data.
Retention
Data points collected are discarded when they are older than this value.
Increasing the retention will also increase memory and cpu usage.
Refresh
Update the graph at this interval. Smaller values will increase cpu
usage.
Line size
Adjust the thickness of the line used to draw the graph.
Scale
Switch the vertical axis between logarithmic (preferred) and linear
scaling.